
Debugging
Running your code step-by-step during development allows you to see what each line of code is doing. This allows you to verify each line does what you intended it to do
Key Concepts |
|
Terms
| Term | Meaning |
|---|---|
| Bottom-Up Design | A design process that starts by creating and testing each part of the algorithm's functions, then creating the main function to use the parts. |
| Comments | Text explaining the meaning of lines or section of source code so that people other than the coder can understand what the code does. |
| Debugging | A development tool and/or practice used by a software developer to find and fix errors in a program. There are many tools and practices available to choose from depending on the situation. |
| Design | A process used to plan and implement a program's source code. |
| Functional Error | A program error caused using the wrong function or data. The program may run to completion or stop with run-time error. |
| Program Flow Error | A program error caused by missing instructions or instruction executed in the wrong order. The program runs to completion, but produces the wrong output or result. |
| Syntactic Error | a program error caused by misspelling an instruction or failing to use a function correctly. The compiler/assembler fails to build the program or execute it. |
| Top-Down Design | A design process that starts by creating and testing the main section of the program to ensure it executes an algorithm in the correct order, then the details of each part of the algorithm are created and tested. |
| Whitespace | Indents and blank lines in source code used to make code more readable for humans. |
Introduction to Debugging
While developing software, a developer can run a program and note the results.
Results may be:
- Ran to completion and produced the correct results
- Ran to completion and produced the wrong results
- Ran to a point and crashed
- Appears to run and get stuck, not producing any output and not terminating itself
In all but the first case, the output and/or behavior of the program may or may not help the developer find the bug in the program.
The term ‘bug” as a problem related to computer science comes from a problem discovered in 1947. Grace Murray Hopper, computer engineer, found a moth that shorted out a relay contact (https://www.computerhistory.org/tdih/september/9/) . Fortunately, more computer ‘bugs’ today are usually software-related, and less messy to clean up.
Fortunately, developers of the past realized more was needed to help find and remove bugs. Today, modern Integrated Development Environments (IDEs), such as IntelliJ, Eclipse, Visual Studio Code, and even the LC-3 Simulate environment provide debugging tools that provide a deeper view of what is happening while a program is executing.
This unit covers LC-3-specific debugging topics, but the following terms and concepts are fairly standard. You will likely find these tools somewhere in your IDE.
Bug Types
Bugs in assembly code will typically be 1 of a couple of types. Each type has different ways to detect, evaluate, and fix.
Syntactic
These errors are caused by incorrect use of the language/ISA instruction and/or operands. Spelling a command wrong or using the incorrect number of parameters/operands will result in this type of error.
| Process | Action |
|---|---|
| Detect | Assembler error. You will see 1 or more error messages after attempting to assemble your code. In some cases, the error may be in the line immediately before or after the line reported in the error |
| Evaluate | Review the error message and evaluate the instruction at the line number called out in the error. Review documentation for the instruction opcode and number/format of operands |
| Fix | Modify code with correct syntax for problem instruction |
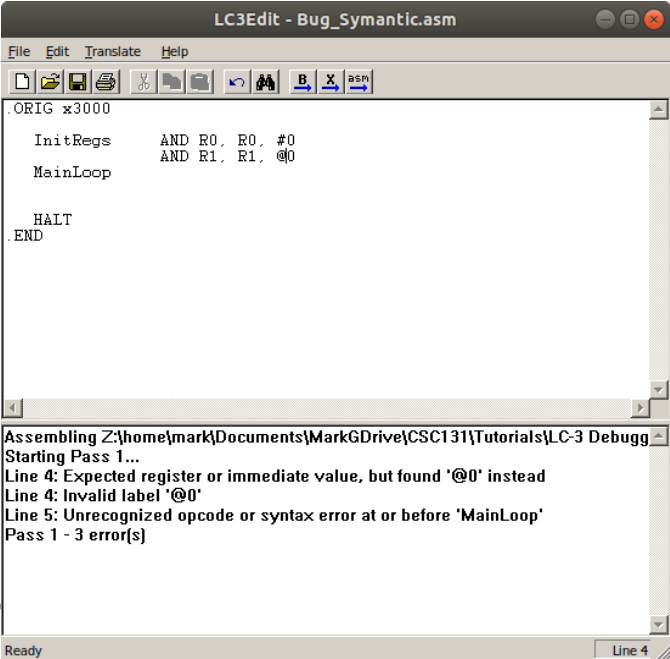
.ORIG x3000

    InitRegs    AND R0, R0, #0
                AND R1, R1, @0

    MainLoop


    HALT
.ENDQuick Question: Choose One
What is the problem in the above code
Functional
In this type of error, the assembler does not show any errors. The program may or may not run to completion. Instructions did not execute as expected. The output is absent, incorrect, or possibly “garbage”.
| Process | Action |
|---|---|
| Detect | Program will start, but may then terminal early. It may also run to completion, but output no or “garbage” results |
| Evaluate | Review output/console. Use incorrect output to locate sections of code with issues. Debug code (see instructions, below) |
| Fix | Modify code to use correct instructions, parameters, and/or labels |
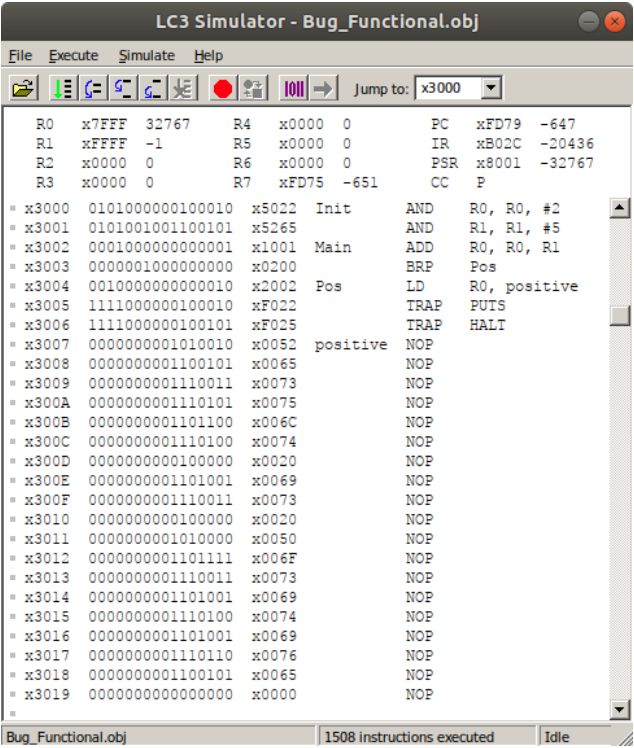
.ORIG x3000

Init    AND R0, R0, #0
        AND R1, R1, #5

Main    ADD R0, R0, R1

Pos     LD R0, positive     ; Bug: LD loads the value at 'positive', not its address
        TRAP x25            ; PUTS requires R0 = address of first character
        HALT

positive .STRINGZ "positive"

.END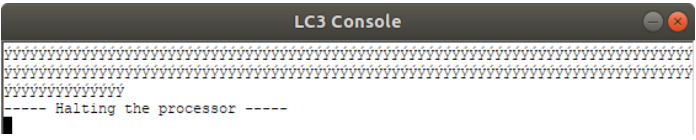
yyyyyyyyyyyyyyyyyyyyyyyyyyyyyyyyyyyyyyyyyyyyyyyyyyyyyyyyyyyyyyy
yyyyyyyyyyyyyyyyy
---- Halting the processor -----Quick Question: Choose One
What is the problem in the above code
Program Flow
In this type of error, the assembler does not show an error and the program runs to completion. All instructions executed are expected. The output is incorrect. It may be absent or duplicated
| Process | Action |
|---|---|
| Detect | Program will run, but product incorrect output |
| Evaluate | Review output/console. Use incorrect output to locate sections of code with issues. Debug code (see instructions, below) |
| Fix | Modify code to implement the correct logic, operations, program flow |
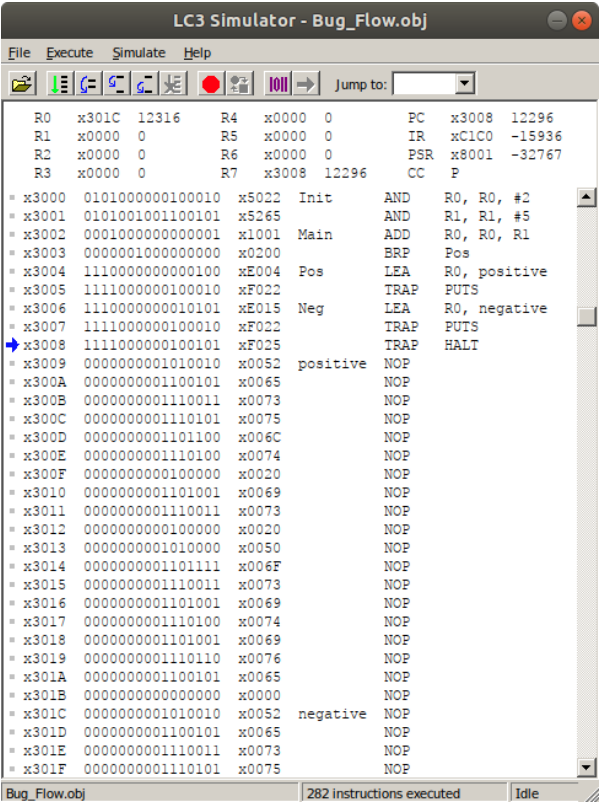
.ORIG x3000

Init    AND R0, R0, #0
        AND R1, R1, #5
        ADD R0, R0, R1

        BRn Neg

Pos     LEA R0, positive
        TRAP x25            ; PUTS
                            ; Bug: missing BRnzp Done to skip Neg section

Neg     LEA R0, negative
        TRAP x25            ; PUTS

Done    HALT

positive .STRINGZ "Result is Positive"
negative .STRINGZ "Result is Negative"

.END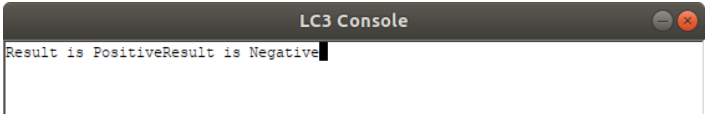
Result is PositiveResult is NegativeQuick Question: Choose One
What is the problem in the above code
Consistent Errors
As strange as it may sound, the best bugs are the ones that occur every time the code ot code segment runs. This unusually indicates the error is something relatively easy to fix.
Bugs that don't occur every time indicates an error causes by some outside influence, such as another code module, driver, or data from an outside source (like the network). These sporadic bugs are more difficult to find because the error must occur to locate the problem(s).
LC-3 Debugging Tools
The Program Counter
Debugging is the process of controlling the Fetch-Decode-Execute (FDE) cycle of assembly instructions.
As you recall, the last thing to occur in this cycle is the PC update in preparation for the next cycle. The Simulate tool provides control over the PC between FDE cycles by stopping before the next Fetch starts.
In effect, debugging allows you to review and manipulate all the registers prior to the next Fetch begins.
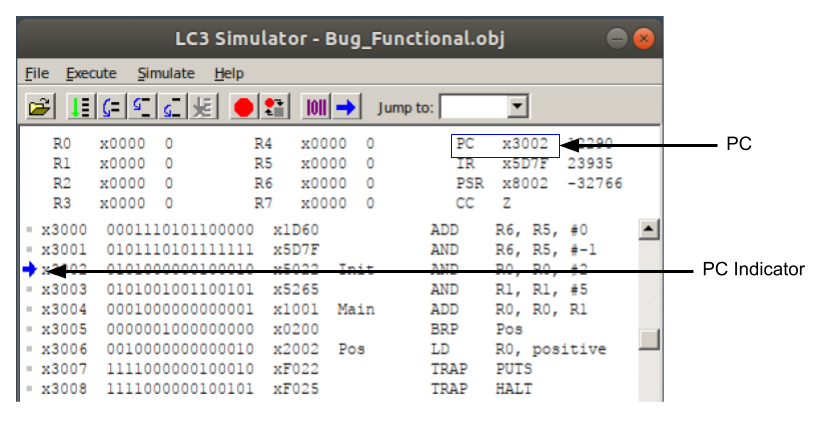
PC - Displays the address of the next instruction that will execute when Fetch begins.
PC Indicator - Visual representation of the PC between FDE cycles.
Execution Control
When a program is loaded, the PC is set to the address identified in the .ORIG Pseudo Op statement and the FDE cycle is halted. The user must take some action to initiate FDE in either run mode or step mode
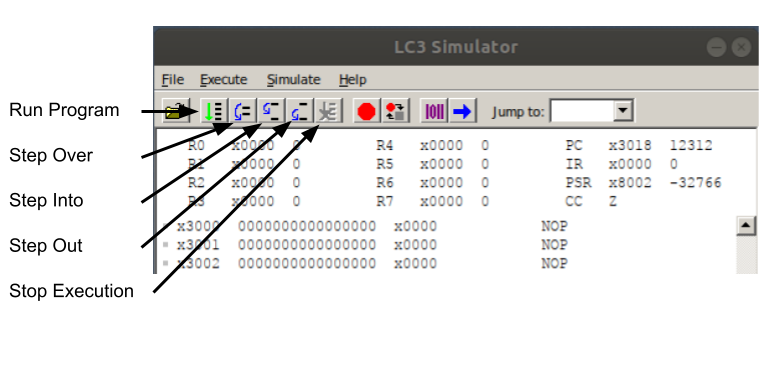
Run Program - Places FDE in Run Mode. FDE is started, and runs until a breakpoint or HALT is encountered.
Step Over - Executes 1 FDE cycle on the current instruction indicated by the PC/PC Indicator If the current instruction is a Subroutine call (JSR/JSRR), the entire subroutine is executed, including the RET on the Subroutine. The FDE is halted at the next PC of the main program.
If the Subroutine calls other Subroutines, they are all executed. Subroutines may have manipulated registers that make have a negative impact on the main program
Step Into - Causes the FDE to stop on the first instruction of a Subroutine (JSR/JSRR). This allows debugging within the Subroutine. Once in the Subroutine, use the Step Over control to execute 1 FDE cycle in the Subroutine. If used in the main program, it is the same as Step Over.
Step Out - Exits a Subroutine and completes the calling instructions FDE. In the case of stepping through a Subroutine, Step Out will complete the Subroutine and return to the next instruction in the main program after the call to the Subroutine If this is used on the main program, it will put the FDE cycle back in run mode and run to completion or the next breakpoint.
Stop Execution - Terminates FDE run mode, and stops at the start of the next FDE cycles. This control is only active when the FDE is in run mode. In the case that the program is waiting for user input or for access to write out to the console, the instructions executed value will be incrementing and the run state show Running.
Breakpoints
With breakpoints, the developer can put FDE in run mode until a desired point on the program. Typically, a breakpoint would be set at a point in the code where a known problem occurs. The developer can allow the code before the problem to execute automatically, and have the FDE cycle pause at the break-pointed instruction.
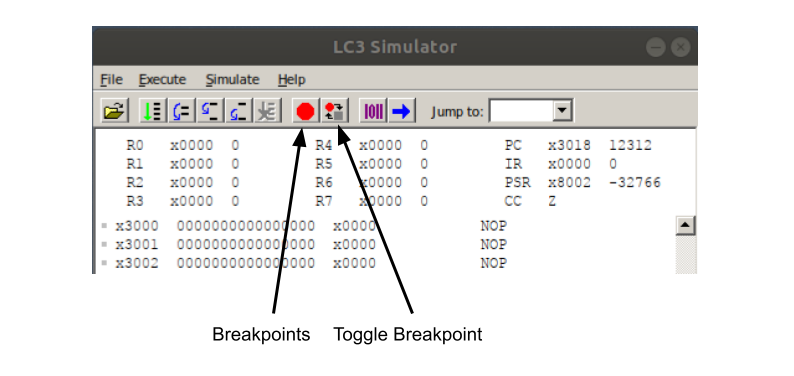
Breakpoint
| Opens a dialog window to set breakpoints at desired PC | |
|---|---|
| 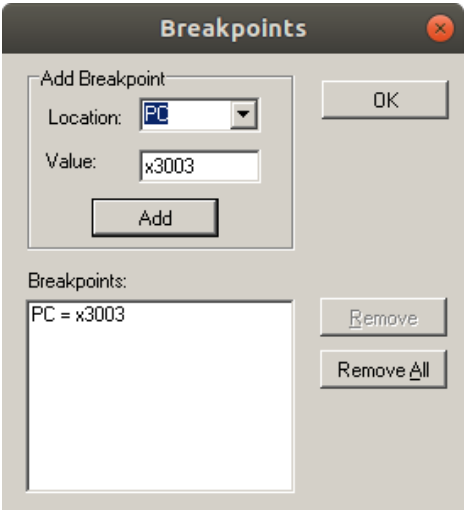 |
Toggle Breakpoint
| Adds or removes breakpoint |
|---|
|
Note the breakpoint indicator appears on the line
| Manually Add Breakpoint | |
|---|---|
| Double click on the desired line to add or remove a breakpoint | 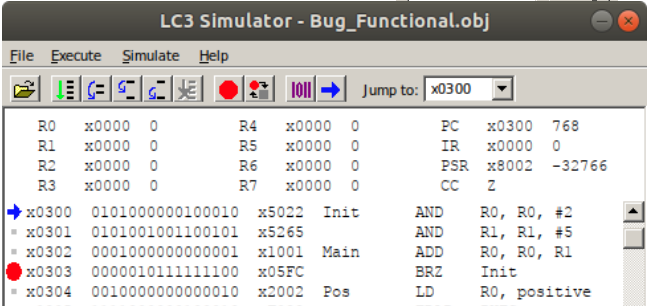 |
Manipulating Registers
While the FDE cycle is stopped between instructions, the registers can be changes alter the program flow or to test a situation.
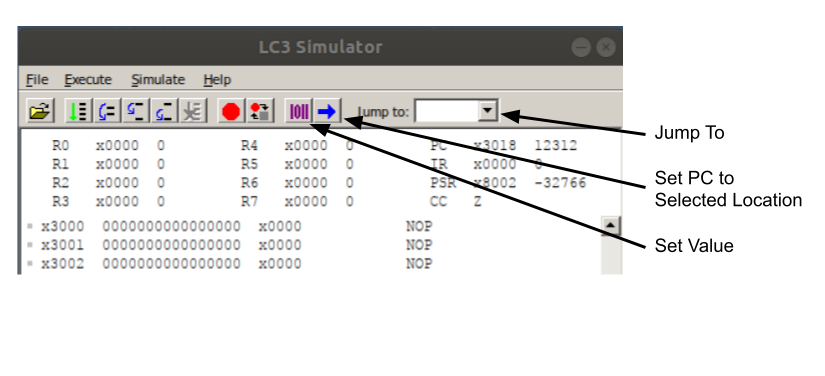
Set Value - Opens a dialog to allow modifying Registers, PC, IR, CC. Once the change or changes have been set in the dialog, clicking OK button will close the dialog and update all modified registers.
| 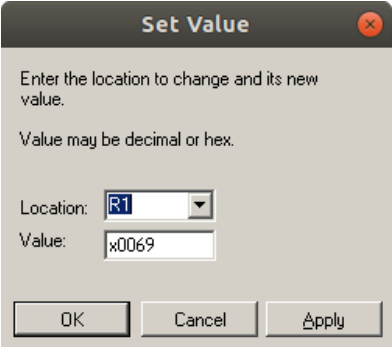 |
Set PC to Selected Location - Quick way to set the PC for the next FDE cycle.
- Click on the desired line (instruction memory address) Line will turn blue
- Click the Set PC to Selected Location button Note the PC changes to the instruction memory address Jump To - Allows different parts of memory to be viewed.The drop down contains memory addresses that have been loaded or accessed
- Select address in dropdown to move to different part of memory
- Type valid address in box and press enter to move to different part of memory
Correcting Bug Types
Syntactic
Misspelling or incorrect use of instructions will cause an error when assembling the program. The assembler will fail to create an .obj file, and will display 1 or more error message.
The error message will include the offending line number and 1 or more helpful error codes/explanation.
How to approach this type of error
- Focus on the first error. Sometimes, the first error may be causing subsequent errors
- Fix the first error and others might disappear
- After implementing a fix to the problem line of code, assemble the program again to see if your fix solved the problem
- Use the line number in the error code to identify the offending line of code.
- Review the syntax and parameters for the instruction. Fix any mistakes noticed
Functional
While using correct instruction and parameters, but in an incorrect way will cause functional errors during code execution.
Errors will show themselves as wrong or garbage outputs. Finding and fixing these errors will reply on your understanding of what the program is supposed to do and how the language works.
How to approach this type of error
- Determine where the error is likely occurring in the source code
- Review the instructions being used before and at this section of code
- If a mistake is obvious, modify the code and assemble/run again
- If the problem still exists, open the code in the debugger
- Set a breakpoint before the error and run to that point
- Review the state of the variables/environment
- Predict what should happen when the next instruction executes
- Step Over that line
- Review what happened and determine of there was a problem
- Repeat the Predict-Step Over-Review cycle
Program Flow
The approach for Program Flow errors is similar to Function Errors, except the focus is on Control Blocks of code that decide and change the flow of the program. Typically If/Else and Looping blocks.
Errors will appear as the wrong block of code executing, code executing too many times, or not at all.
A common looping error is Looping 1 time too many -or- 1 time too few cycles. A common source for this error is the zero-based nature of computers and programming languages
How to approach this type of error
- Determine where the error is likely occurring in the source code
- Review the Control Block to understand what is supposed to occur
- If a mistake is obvious, modify the code and assemble/run again
- If the problem still exists, open the code in the debugger
- Set a breakpoint before entering the Control Block
- Review the state of the variables/environment before entering the Control Block
- Predict what should happen when entering the Control Block
- Step Over that line
- Review what happened and determine of there was a problem
- Step through the code inside the Control Block
- Verify the correct use of any control variable, such as loop counters
- Repeat the Predict-Step Over-Review cycle
Conclusion
Bugs will be a common part of writing software. While course work of college may be fairly simple, working in the industry will require understanding and modifying large and complex programs.
An understanding of the Language Syntax and Function of the program are needed to effectively find and correct errors.
Tools that build and run programs provide some capabilities to identify errors with the code
- Assembler/Compiler identified Syntactic Errors
- IDE Debugging tools allow insight into what is happening when each instruction executes to help find Functional and Program Flow Errors